Viewing metrics in the Amazon RDS console
Amazon RDS integrates with Amazon CloudWatch to display a variety of RDS DB instance metrics in the RDS console. For descriptions of these metrics, see Metrics reference for Amazon RDS.
For your DB instance, the following categories of metrics are monitored:
-
CloudWatch – Shows the Amazon CloudWatch metrics for RDS that you can access in the RDS console. You can also access these metrics in the CloudWatch console. Each metric includes a graph that shows the metric monitored over a specific time span. For a list of CloudWatch metrics, see Amazon CloudWatch metrics for Amazon RDS.
-
Enhanced monitoring – Shows a summary of operating-system metrics when your RDS DB instance has turned on Enhanced Monitoring. RDS delivers the metrics from Enhanced Monitoring to your Amazon CloudWatch Logs account. Each OS metric includes a graph showing the metric monitored over a specific time span. For an overview, see Monitoring OS metrics with Enhanced Monitoring. For a list of Enhanced Monitoring metrics, see OS metrics in Enhanced Monitoring.
-
OS Process list – Shows details for each process running in your DB instance.
-
Performance Insights – Opens the Amazon RDS Performance Insights dashboard for a DB instance. For an overview of Performance Insights, see Monitoring DB load with Performance Insights on Amazon RDS. For a list of Performance Insights metrics, see Amazon CloudWatch metrics for Performance Insights.
Amazon RDS now provides a consolidated view of Performance Insights and CloudWatch metrics in the Performance Insights dashboard. Performance Insights must be turned on for your DB instance to use this view. You can choose the new monitoring view in the Monitoring tab or Performance Insights in the navigation pane. To view the instructions for choosing this view, see Viewing combined metrics in the Amazon RDS console.
If you want to continue with the legacy monitoring view, continue with this procedure.
Note
The legacy monitoring view will be discontinued on December 15, 2023.
To view metrics for your DB instance in the legacy monitoring view:
Sign in to the AWS Management Console and open the Amazon RDS console at https://console.aws.amazon.com/rds/
. -
In the navigation pane, choose Databases.
-
Choose the name of the DB instance that you want to monitor.
The database page appears. The following example shows an Oracle database named
orclb.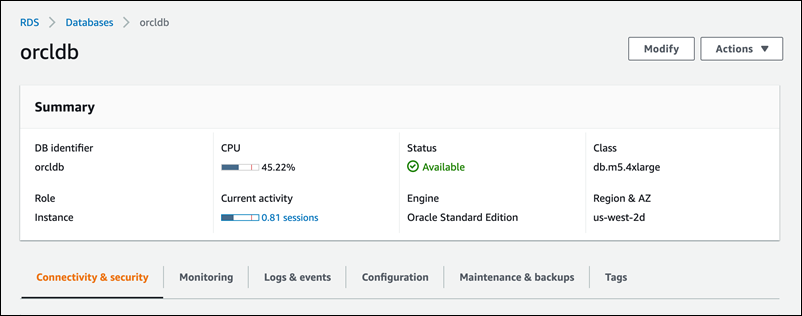
-
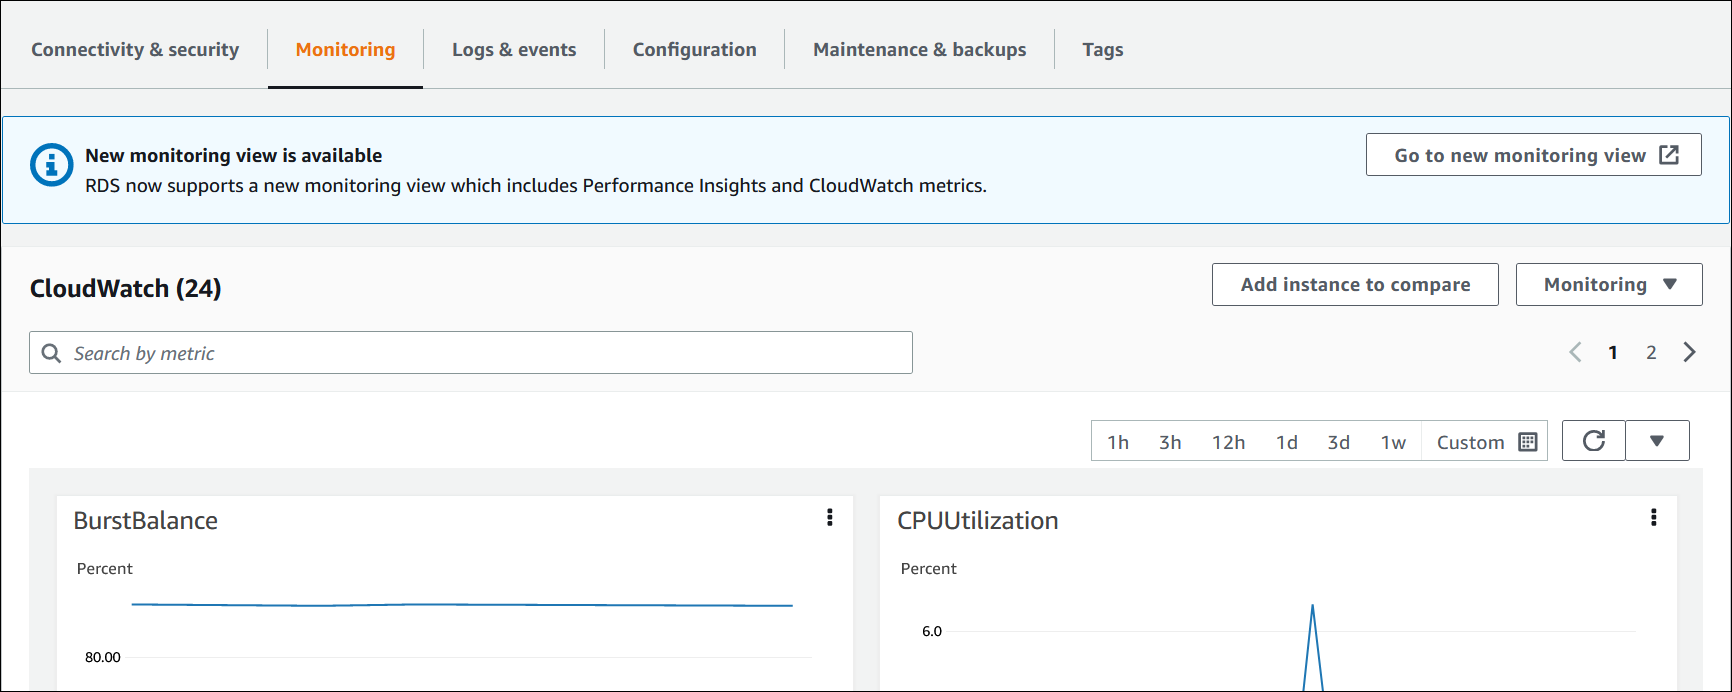
Scroll down and choose Monitoring.
The monitoring section appears. By default, CloudWatch metrics are shown. For descriptions of these metrics, see Amazon CloudWatch metrics for Amazon RDS.
-
Choose Monitoring to see the metric categories.
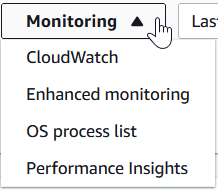
-
Choose the category of metrics that you want to see.
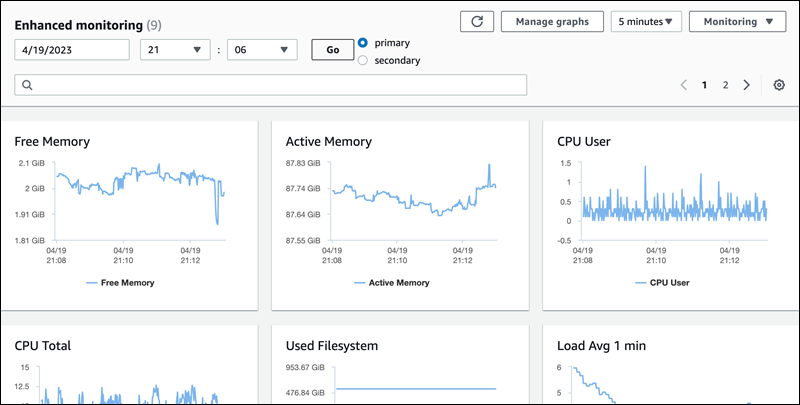
The following example shows Enhanced Monitoring metrics. For descriptions of these metrics, see OS metrics in Enhanced Monitoring.
Note
Currently, viewing OS metrics for a Multi-AZ standby replica is not supported for MariaDB DB instances.
Tip
To choose the time range of the metrics represented by the graphs, you can use the time range list.
To bring up a more detailed view, you can choose any graph. You can also apply metric-specific filters to the data.
