Get statistics for a specific resource
The following example shows you how to determine the maximum CPU utilization of a specific EC2 instance.
Requirements
-
You must have the ID of the instance. You can get the instance ID using the Amazon EC2 console or the describe-instances command.
-
By default, basic monitoring is enabled, but you can enable detailed monitoring. For more information, see Enable or Disable Detailed Monitoring for Your Instances in the Amazon EC2 User Guide for Linux Instances.
To display the average CPU utilization for a specific instance using the console
-
Open the CloudWatch console at https://console.aws.amazon.com/cloudwatch/
. -
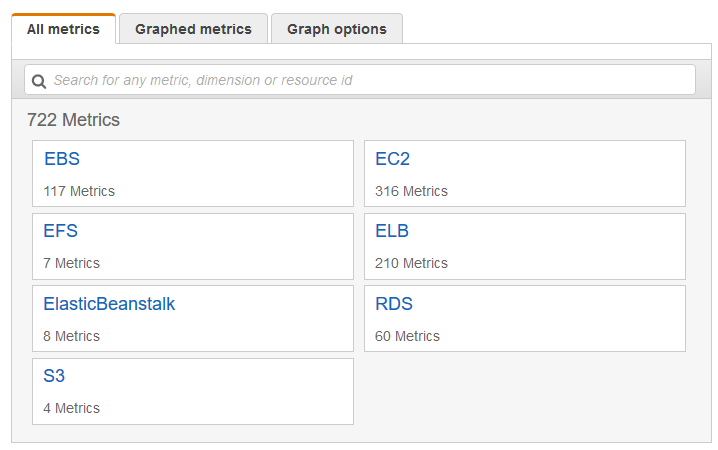
In the navigation pane, choose Metrics.
-
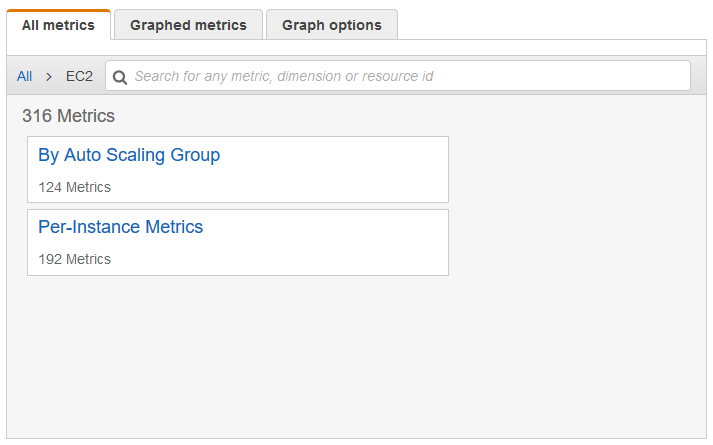
Select the EC2 metric namespace.
-
Select the Per-Instance Metrics dimension.
-
In the search field, enter
CPUUtilizationand press Enter. Select the row for the specific instance, which displays a graph for theCPUUtilizationmetric for the instance. To change the name of the graph, choose the pencil icon. To change the time range, select one of the predefined values or choose custom.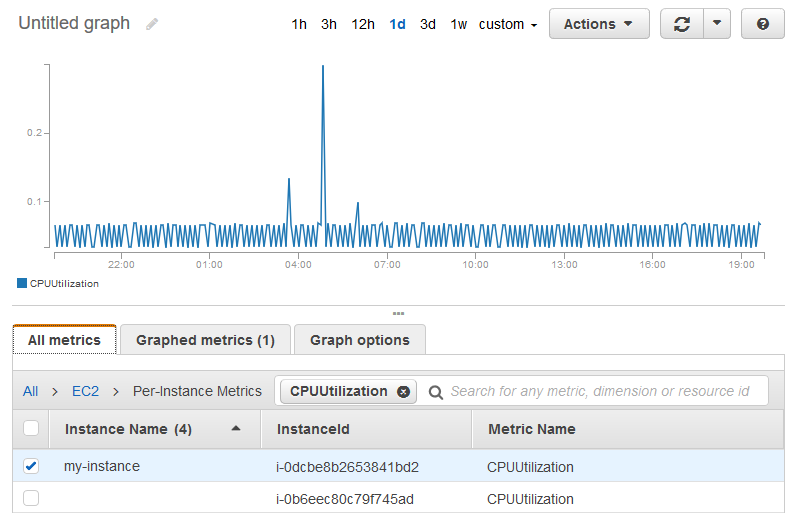
-
To change the statistic, choose the Graphed metrics tab. Choose the column heading or an individual value and then choose one of the statistics or predefined percentiles, or specify a custom percentile (for example,
p99.999).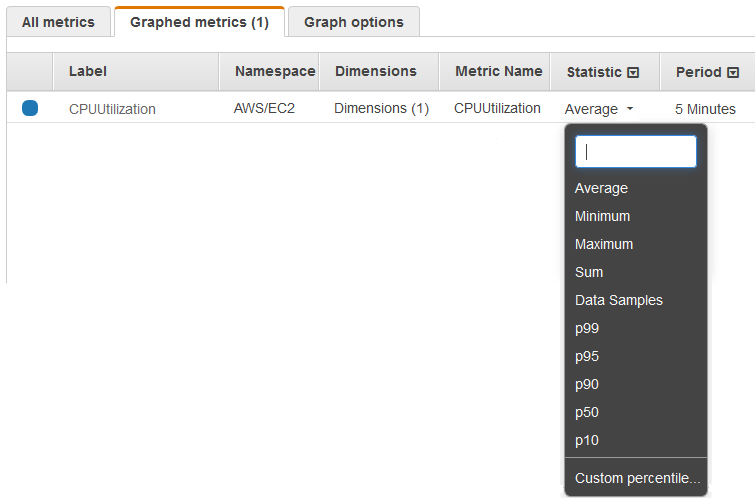
-
To change the period, choose the Graphed metrics tab. Choose the column heading or an individual value, and then choose a different value.
To get the CPU utilization per EC2 instance using the AWS CLI
Use the get-metric-statistics command as follows to get the CPUUtilization
metric for the specified instance.
aws cloudwatch get-metric-statistics --namespace AWS/EC2 --metric-name CPUUtilization \ --dimensions Name=InstanceId,Value=i-1234567890abcdef0--statistics Maximum \ --start-time2016-10-18T23:18:00--end-time2016-10-19T23:18:00--period 360
The returned statistics are 6-minute values for the requested 24-hour time interval. Each value represents the maximum CPU utilization percentage for the specified instance for a particular 6-minute time period. The data points aren't returned in chronological order. The following shows the beginning of the example output (the full output includes data points for every 6 minutes of the 24-hour period).
{
    "Datapoints": [
        {
            "Timestamp": "2016-10-19T00:18:00Z",
            "Maximum": 0.33000000000000002,
            "Unit": "Percent"
        },
        {
            "Timestamp": "2016-10-19T03:18:00Z",
            "Maximum": 99.670000000000002,
            "Unit": "Percent"
        },
        {
            "Timestamp": "2016-10-19T07:18:00Z",
            "Maximum": 0.34000000000000002,
            "Unit": "Percent"
        },
        ...
    ],
    "Label": "CPUUtilization"
}
